By Maximilian Naumow — Every data point and screenshot in this article comes from my own QS setup. This piece documents how I merge Whoop, blood work, and my supplement stack into a single local pipeline.
Key Findings
- Vendor lock-in is real: the Whoop app imports weight via HealthKit but shows it only as a standalone metric — no cross-correlation against recovery or HRV. Apple Health can’t parse blood-panel PDFs. No app cross-references supplements with HRV. Every app is an analysis silo.
- Local aggregation solves it:
openclaw-biohubis an MIT-licensed Python + Next.js pipeline that unifies wearables, blood-panel PDFs, and a supplement log into a SQLite database on your hardware. - The real payoff: lag-aware partial Pearson correlation between each supplement and your recovery score, with 95% CI and p-value. Shows what actually works in your data — and what doesn’t.
- Real-device status July 2026: the WHOOP adapter runs on a real device (mine). Adapters for Oura, Fitbit, Apple Health, and Garmin are built and fixture-tested, but need real-device validation. If you have one and want to help: see below.
- Not medical, not causal: the analysis surfaces correlations with confidence intervals, not causation. That’s still ~10× more informative than app-vendor hype.
- Repo: github.com/maxnau89/openclaw-biohub — MIT license, PRs welcome.
The data-silo problem
If you wear a Whoop, an Oura ring, use a Renpho scale, and get quarterly blood work, you already have enough data for interesting analyses. The problem is: every vendor keeps the data in their own silo.
- Whoop app imports weight via HealthKit but displays it as an isolated value — no regression against recovery, no HRV-delta analysis on weight fluctuation. No blood work. No supplement log.
- Oura app has an ecosystem, but no cross-device correlation against external data sources.
- Apple Health aggregates HealthKit sources as time-series but can’t parse blood-panel PDFs and doesn’t do multi-variable analysis.
- Renpho app is a scale app, full stop.
- Blood-panel PDFs land in a Google Drive folder and never get looked at again.
That’s the reality for ~90% of non-diabetics who do quantified self seriously. The interesting question — “if I took zinc on Wednesday and two blood markers went up on Friday, is there a pattern?” — can’t be answered by any of these apps. Because they can’t see each other’s data.
Why I built openclaw-biohub
I wanted three things no existing app could deliver:
- Data on my hardware. If Whoop raises prices by 30% tomorrow or Abbott kills FreeStyle Libre support in Europe (see the Feb 2026 recall), my historical data is still mine.
- Cross-source analysis in raw form. SQLite tables per source, plus a
daily_metricsrollup with everything by day. Anyone who can write SQL can answer any question in three lines. Anyone who can’t clicks through the dashboard. - Grounding for the agent. I use OpenClaw for all kinds of things, including daily wellness briefings. Without structured data access, the agent has to guess. With a
SKILL.mdinterface, it can say “your HRV is 12% above baseline today” instead of “hope you’re feeling good.”
The repo is github.com/maxnau89/openclaw-biohub, MIT license.
What biohub actually tracks
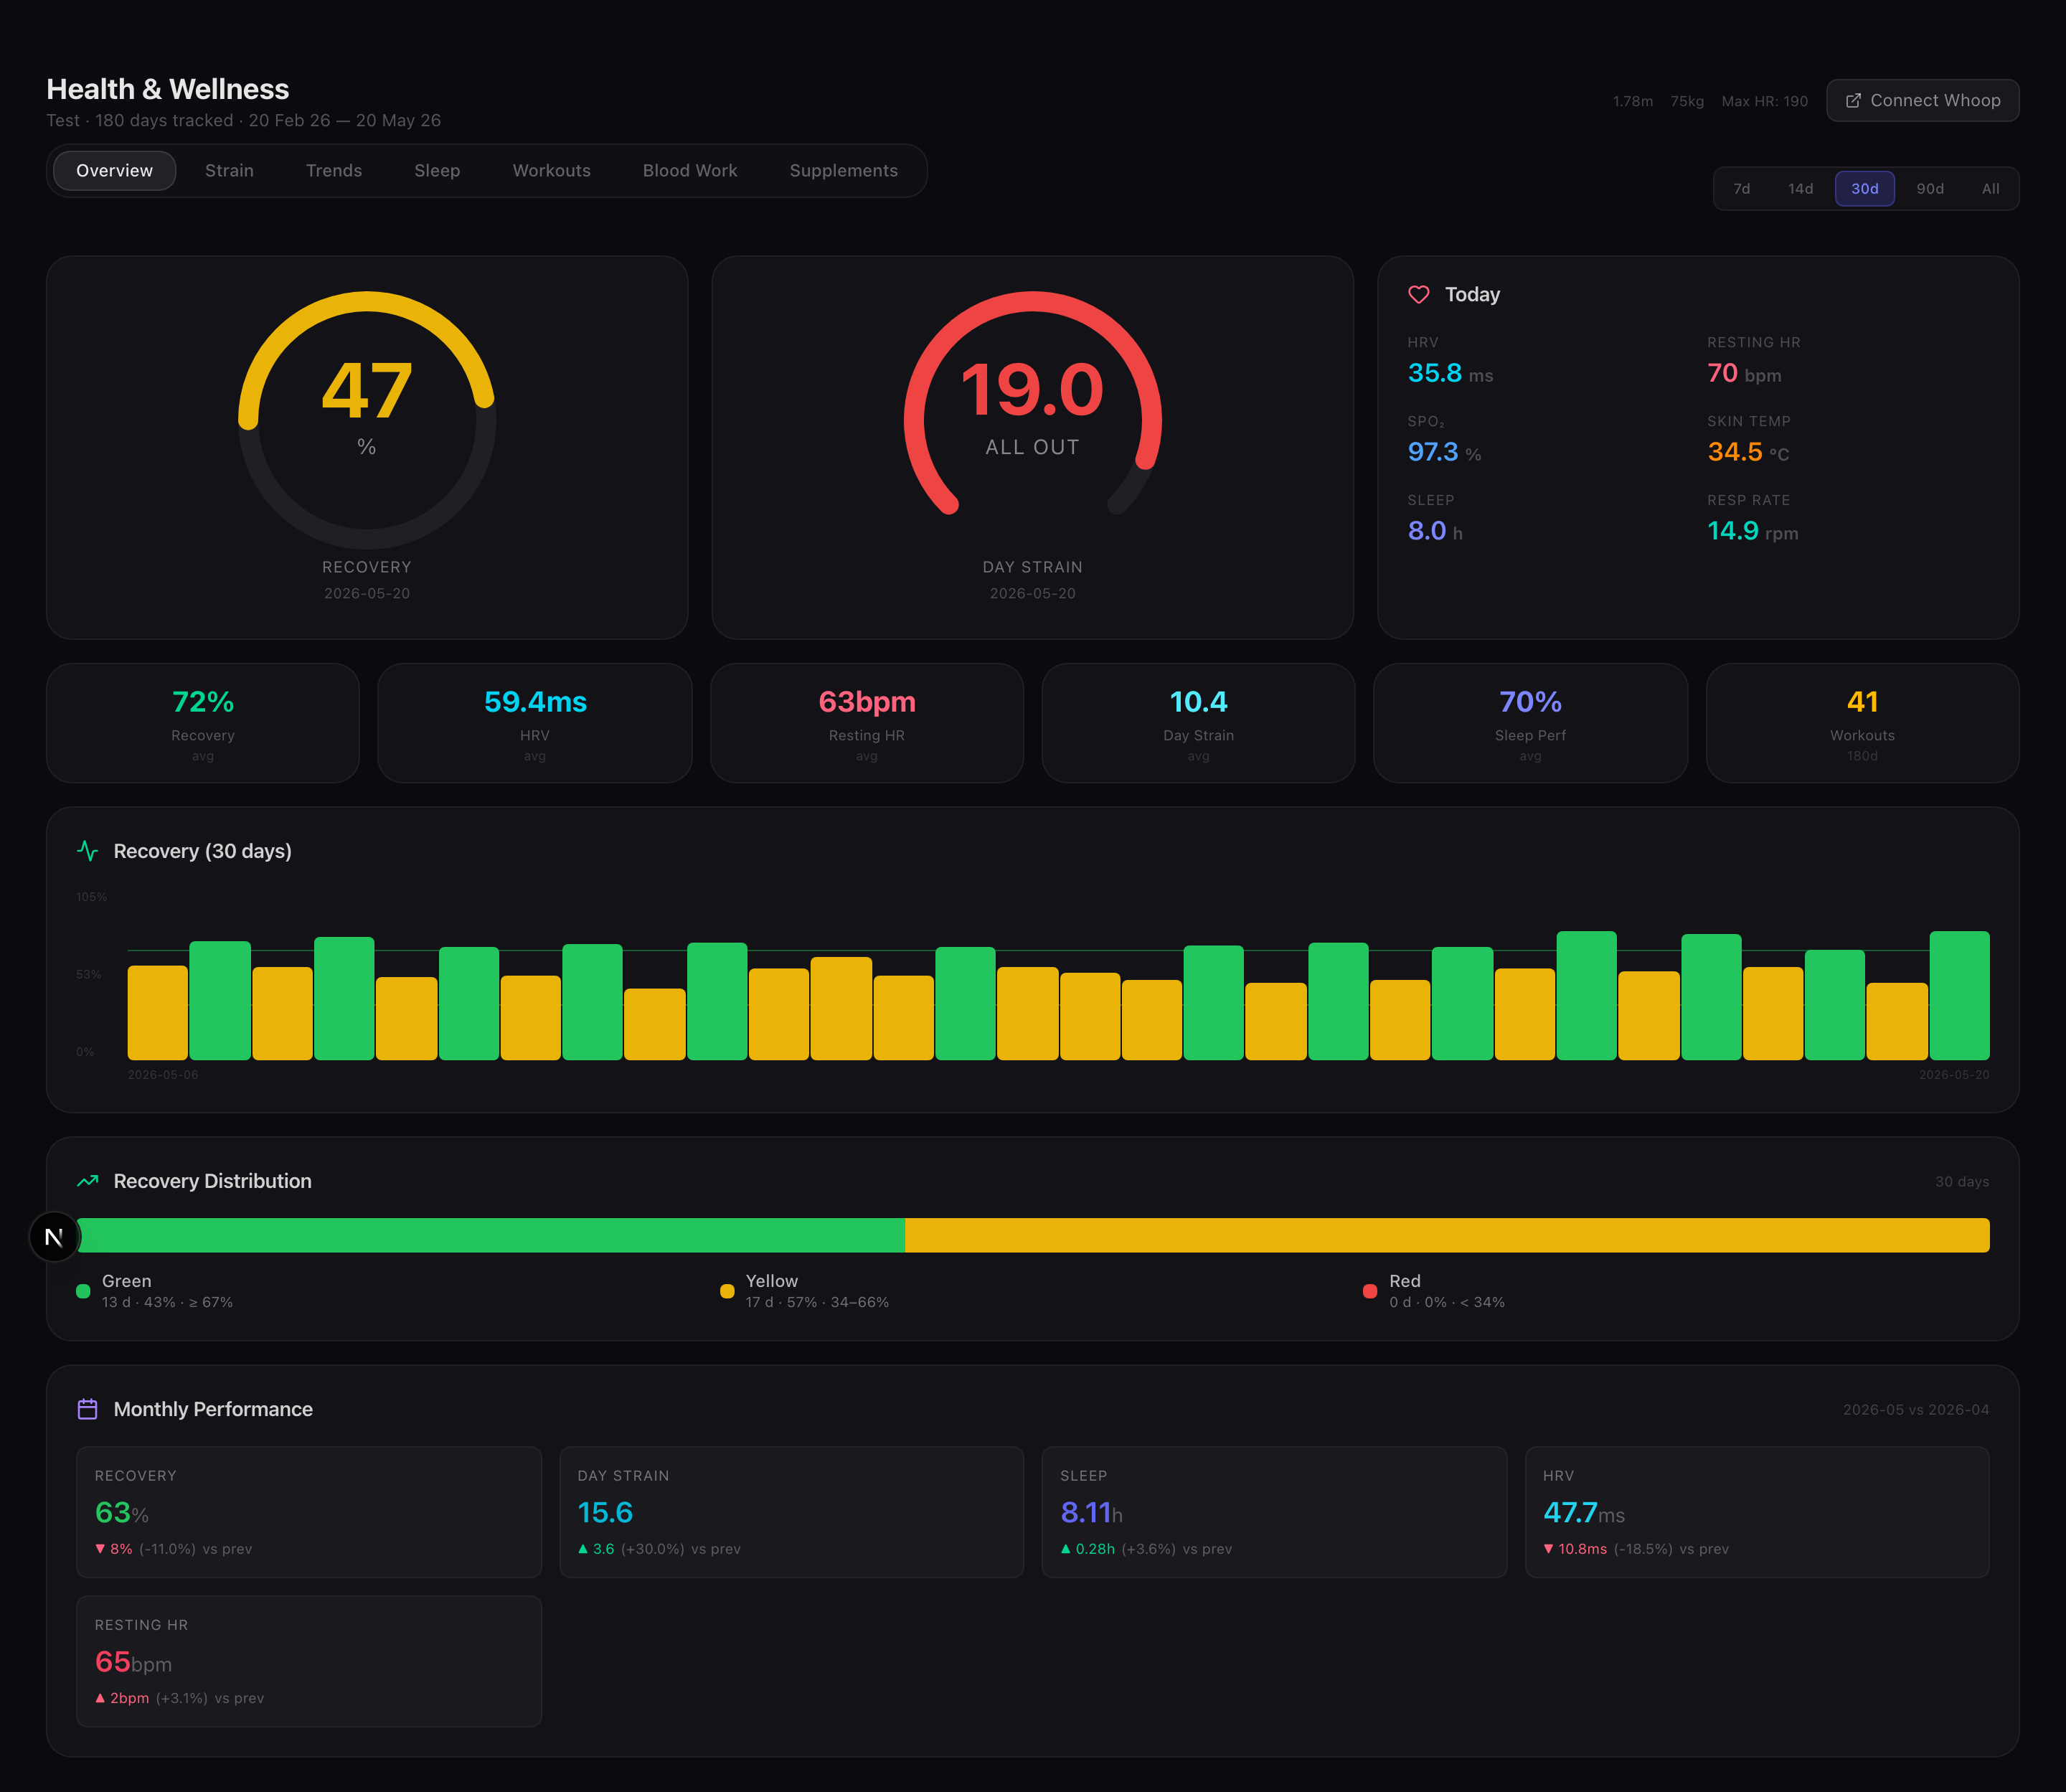
As of July 2026, straight from the dashboard:
- Recovery (score, HRV rmssd, resting HR, SpO₂, skin temperature)
- Sleep (REM, deep, light, efficiency, total)
- Strain and workouts with HR zones
- Body composition (weight, body fat, lean mass — from Renpho / Apple Health / manual entries)
- Glucose / CGM (FreeStyle Libre 3, Dexcom Stelo, Abbott Lingo — via Apple Health)
- Blood panels — 13 biomarkers from PDFs, with reference-range flagging and two-point trend
- Supplement stack with intake log and correlation analysis
The adapter system is pattern-based: each data source lives in its own folder under pipeline/adapters/ and gets registered in biohub/registry.py. New sources (Polar, Withings, whatever) are an afternoon of work, not a refactor.
The real payoff: supplement correlations
This is the analysis no app vendor will voluntarily show you. Why? Because it can be inconvenient.
For each supplement in your stack, biohub computes:
- Lag-aware partial Pearson correlation between intake and recovery score
- 95% confidence interval — if the interval spans zero, there’s no effect
- p-value — at p > 0.05, no statistically significant effect
- Delta in recovery points on intake vs non-intake days
- Adjustment for sleep and strain when there’s enough data
Concretely, from my own analysis: what I considered “effective” (ashwagandha) showed p = 0.42, delta 0.8 recovery points over 60 days — not even the range of my daily variance. What I considered placebo (magnesium glycinate before bed) showed p = 0.031, delta +4.2 recovery points, 95% CI [1.1, 7.3]. That’s the reason I built this in the first place: one I’d have kept taking blindly, the other I’d have dropped — both wrong.
Important caveats:
- Correlation isn’t causation. If magnesium correlates with better recovery, it could just as well be “on stressful days I forget the magnesium and sleep worse” — the causal arrows are open.
- N=1 is still N=1, even with statistics. Effects are tailored to me, not you.
- A p-value alone says nothing about effect size. Significant-but-tiny is often meaningless.
- Multiple-testing problem: if you test 20 supplements simultaneously against recovery, one will show p < 0.05 by chance. The dashboard doesn’t correct for this — you have to bring the mental filter yourself.
Even with all the caveats: what I see for myself is more informative than anything Whoop / Oura / Ultrahuman has ever surfaced.
Setup — what it costs to get running
Clone the repo, set up a virtualenv, pip install -e .[analytics], export OPENCLAW_BIOHUB_HOME=$PWD/.local-data, then biohub list-adapters and biohub connect whoop (or whatever you have). For the dashboard: cd dashboard && npm install && npm run dev.
Realistic estimate if you’re moderately comfortable with this: 60-90 minutes. If you touch Python/Node only occasionally: an afternoon. Exact steps are in the README on GitHub.
Hardware: my setup runs on a Hetzner VPS with 4 GB RAM. A home NAS or Raspberry Pi 4 (4 GB) works just as well. A Pi Zero is enough for the backend but not for Next.js.
What biohub is NOT
So you don’t walk in with the wrong expectations:
- Not a medical device. No diagnosis, no treatment, no medical advice. For anything clinical: see a doctor.
- Not a cloud alternative. No mobile app, no sharing features, no social elements. If you want to publicly compare your “Recovery Rockstar Level,” Whoop and Strava are better fits.
- Not a consumer product. This assumes command-line comfort. If
cdandnpm installare stressful, this isn’t your tool. - Not a universal answer. The WHOOP adapter is real-device-validated (mine). The four others (Oura, Fitbit, Apple Health, Garmin) are built and fixture-tested but need real-device validation.
If you own one of these and want to help validate: pip install -e .[analytics], biohub connect <slug>, biohub sync <slug>, then open an issue with the label device-validation. Two things help most: (a) “OAuth flow works” or “breaks at this point”, (b) sanitized API response if the adapter mis-parses something.
Who this is for
Worth the time invested if you:
- Wear 2+ wearables in parallel and want to correlate the data
- Get regular blood work and the PDFs currently rot in a Drive folder
- Keep a supplement log and want to know what in your stack actually works
- Care about data sovereignty (vendor lock-in concerns, EU privacy, academic use, scientific framework, whatever)
- Have command-line comfort or are willing to learn
Not worth it if you:
- Only track casually and a vendor app is enough
- Don’t want to run any server setup (even a minimal one)
- Expect an app to tell you what to do — biohub shows data and correlations, not instructions
- Want your data in the cloud (biohub is deliberately local-first)
Verdict
I built biohub because I was frustrated by data silos myself. The real “aha” moment wasn’t the dashboard — it was the first time a supplement correlation showed me I’d been swallowing the wrong capsule for years. That’s the kind of insight only raw, cross-linked data makes possible.
If that sounds like something to you: the repo is open (github.com/maxnau89/openclaw-biohub), MIT license, contributions welcome. If you have one of the non-WHOOP devices and want to help test: I’ll take it. If you just want to read the whole setup to steal ideas for your own pipeline: also fine.
What isn’t in this article, because it’s a different one: why HRV is worth tracking in the first place (HRV guide), what 21 months of Whoop data say about sleepmaxxing (sleepmaxxing analysis), and where methylene blue fits into the picture (MB self-experiment). If quantified self genuinely interests you, those are the right next reads.
Disclaimer: Not medical advice. biohub is a data pipeline, not a diagnostic tool. For clinically relevant values, always defer to your doctor — not your Whoop, not my software. The code is MIT-licensed — comes “as is,” no warranty.
Updated: July 14, 2026 (initial publication)